What is the point of quantifying transit access if we do not focus on those who need it the most?
Introduction and Motivation
In my studies, I am particularly interested in urban sustainability, with personal goals of becoming an urban planner. I have always been interested in public transportation, so I wanted to use my ArcGIS skills to investigate public transportation and its accessibility across the NYC Metro Area. I started with SDG 11.2.1.
SDG 11.2.1 indicates the proportion of the population that has convenient access to public transport, by sex, age and persons with disabilities. While it is important to disaggregate data in these methods, I noticed a significant omission: low-income.
In the context of North America, persons designated as "low-income" disproportionately use transit. UCLA's Lewis Center for Regional Policy Studies argues that low-income residents use public transit at a rate 2.5 times more than higher-income residents, attributing this largely to the high costs ofowning and operating automobiles. Additionally, the Urban Institute shows that low-income residents spend approximately 24% of their income on transit. The combination of high car costs and the high financial burden that low-income residents face in paying for transit creates conditions where these populations are at higher risk.
Therefore, it is important to find areas without good transit access, areas designated as "low-income," find the intersection of these areas, and quantify the number of low-income residents without access to public transit.
Method and Process
In order to conduct this analysis, I focused specifically on the NYC Metro Area, especially considering its high presence of transit, making gaps in transit especially important.
Information and Data Collection
All the data I used was collected using ArcGIS Online. I used a dataset of regional rail stations from the NYC Department of City Planning's Regional Planning department (username: DCP_Regional). I used a dataset of subway stations from the NYC Department of City Planning, Housing department (username: DCP_HEIP). I used a dataset from the U.S. Department of Housing and Urban Development that shows "Qualified Census Tracts," meaning census tracts "in which at least 50 percent of households have an income less than 60percent of the Area Median Gross Income (AMGI), or which has a poverty rate of at least 25 percent" (username: HUD.Official.Content). My datasets of New Jersey, New York, and Connecticut's towns came from the NJ Office of Information Technology Office of GIS (username: NJOGIS), the New York State Office of Information Technology Services (username: Open_Data_Admin), and the Connecticut Department of Energy and Environmental Protection (username: deepgis), respectively.
In addition, official United Nations Human Settlements Program for SDG indicator 11.2.1 metadata defines "convenient access to high-capacity transit" as within 1 kilometer (km). In my analysis I used this 1km buffer to find areas without access to transit. Moreover, while SDG indicator 11.2.1 measures transit access using "low-capacity transit" as well (meaning buses), I only conducted analysis for high-capacity. This affects some results in outlying suburban areas where there is bus transit, no regional rail, and low-income areas. However, due to the high presence of buses in the NYC Metro Area, many low-income transit-deserted areas likely already have transit access. I believe that access to high-quality high-capacity transit should be the ultimate goal for communities across the NYC Metro Area. Therefore, I focused solely on these modes of transit.
In order to map transit access, I first made a buffer layer with 1km around transit stops.
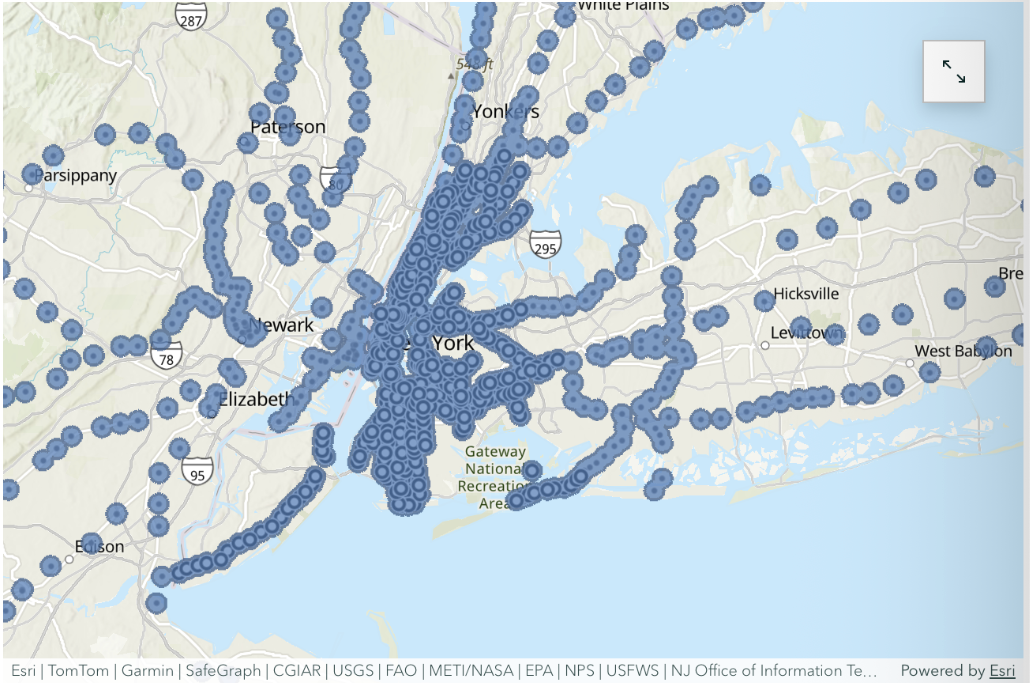
Figure 1: NYC areas easily accessible by High-Speed Transit (within 1km of NYC subway or commuter rail, transit stops are indicated)
Then, I found Qualified Low-income Census Tracts (pink) that were outside of the Accessible (blue) zone. This area, low-income areas with low access to high capacity transit, in red, highlights important areas for future transit development. I used the Enrich tool to find the 2025 Population within these areas. This tool uses ArcGIS Online's data.
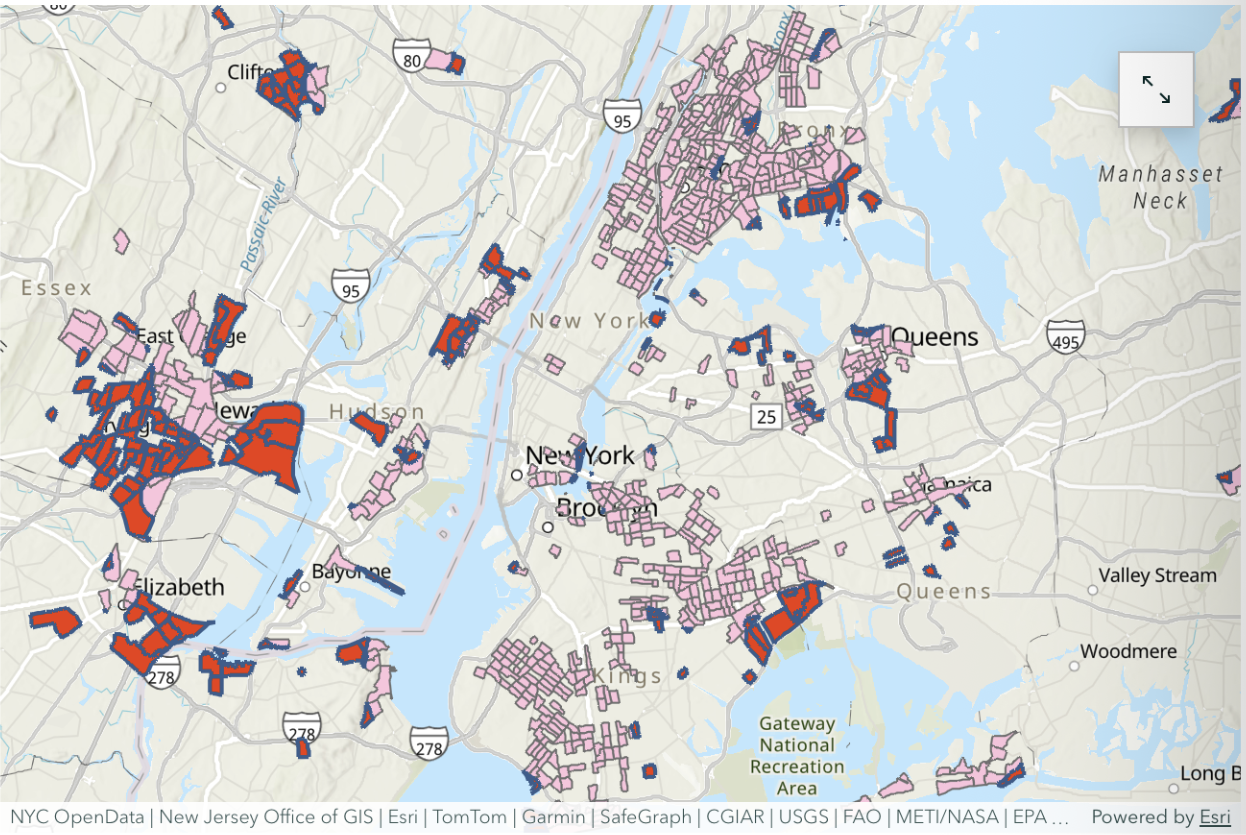
Figure 2: NYC Qualified Low-Income Census Tracts (pink) and Areas with low income and low access to high-capacity transit (red)
After this step, I used town boundaries for New York, New Jersey, and Connecticut to quantify the number of low-income residents without access to high-capacity transit in each town. This mirrors the requirements for "SDG Indicator 11.2.1: Proportion of population that has convenient access to public transport," which is calculated per city or urban area. For my analysis, in order to pinpoint specific towns with high need, using town-level data allows for this.
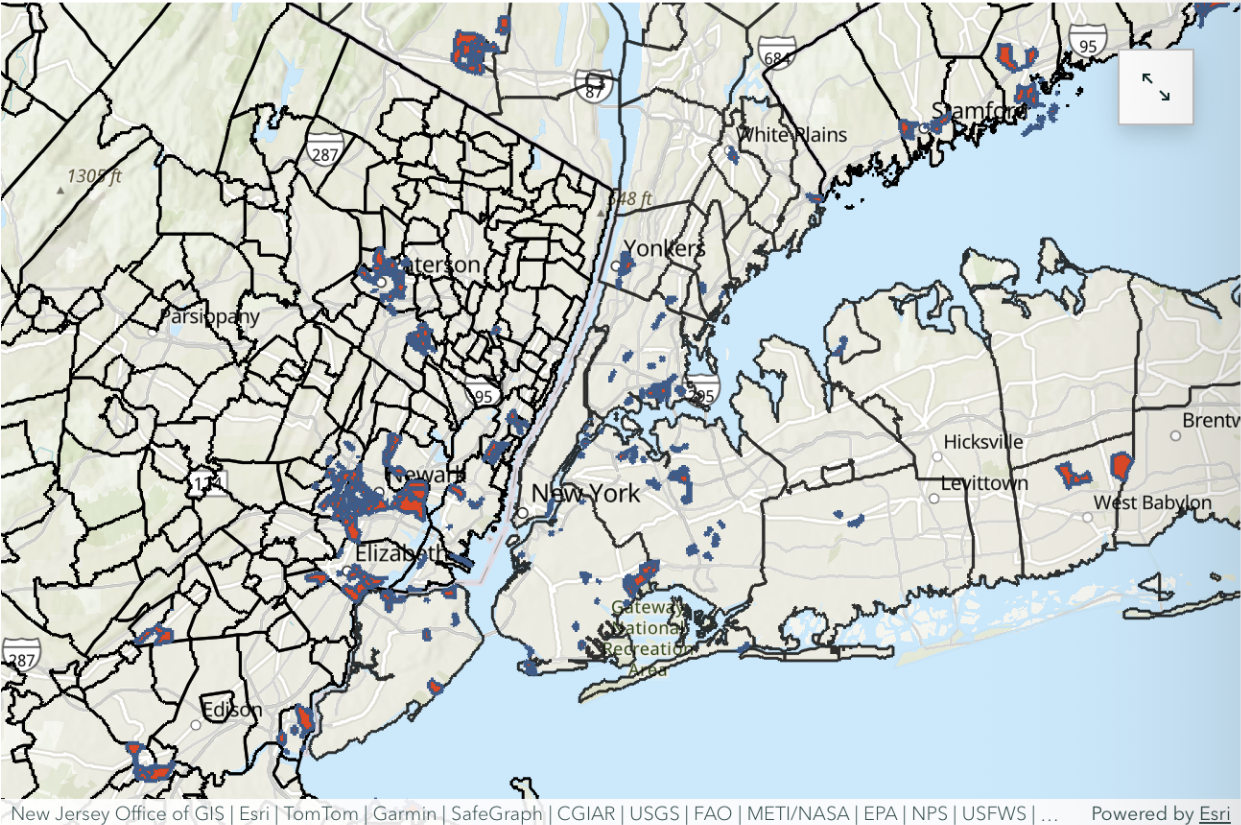
Figure 2: NYC Qualified Low-Income Census Tracts (pink) and Areas with low income and low access to high-capacity transit (red)
After this step, I used town boundaries for New York, New Jersey, and Connecticut to quantify the number of low-income residents without access to high-capacity transit in each town. This mirrors the requirements for "SDG Indicator 11.2.1: Proportion of population that has convenient access to public transport," which is calculated per city or urban area. For my analysis, in order to pinpoint specific towns with high need, using town-level data allows for this.
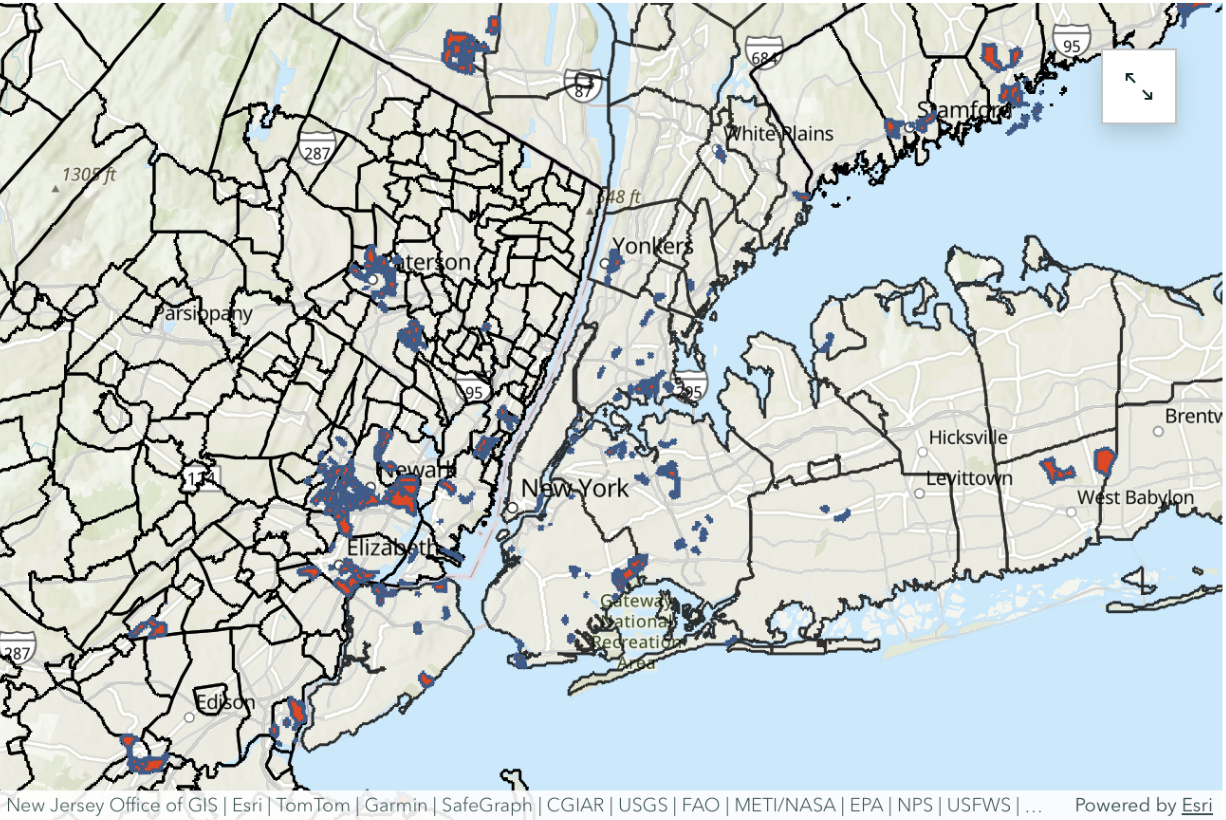
Figure 3: Towns in the NYC Metro Area and corresponding low-income areas with low access to high-capacity transit
The last step in my analysis was to perform Zonal and Summary Statistics on each town in New York, New Jersey, and Connecticut in order to find the total population in each town that is low-income with low access to high-capacity transit. Then, I used the Enrich tool to find the total population in each town using ArcGIS Online's data. With this, I calculated a field for the proportion of a town's residents that are low-income with low access to high-capacity transit.
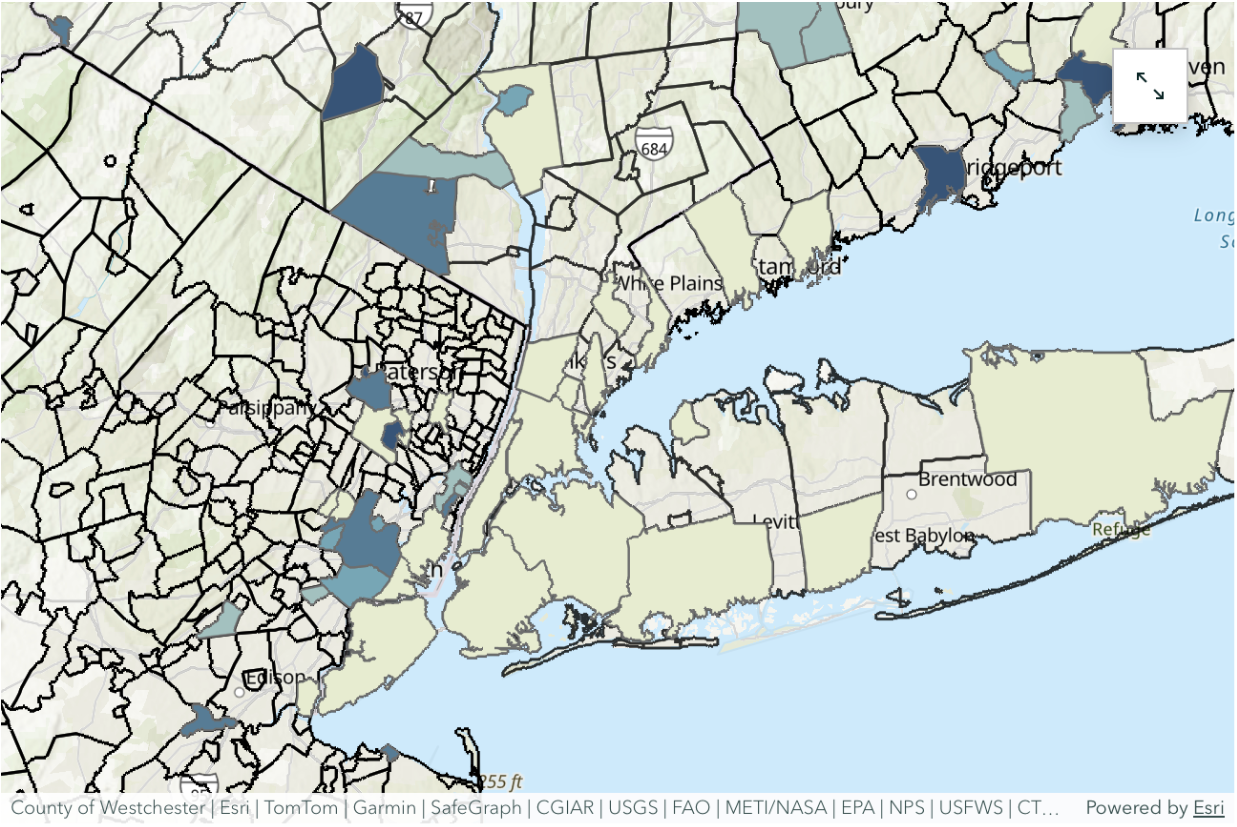
Figure 4: NYC Metro Area, Towns with low-income and low access to high-capacity transit, mapped
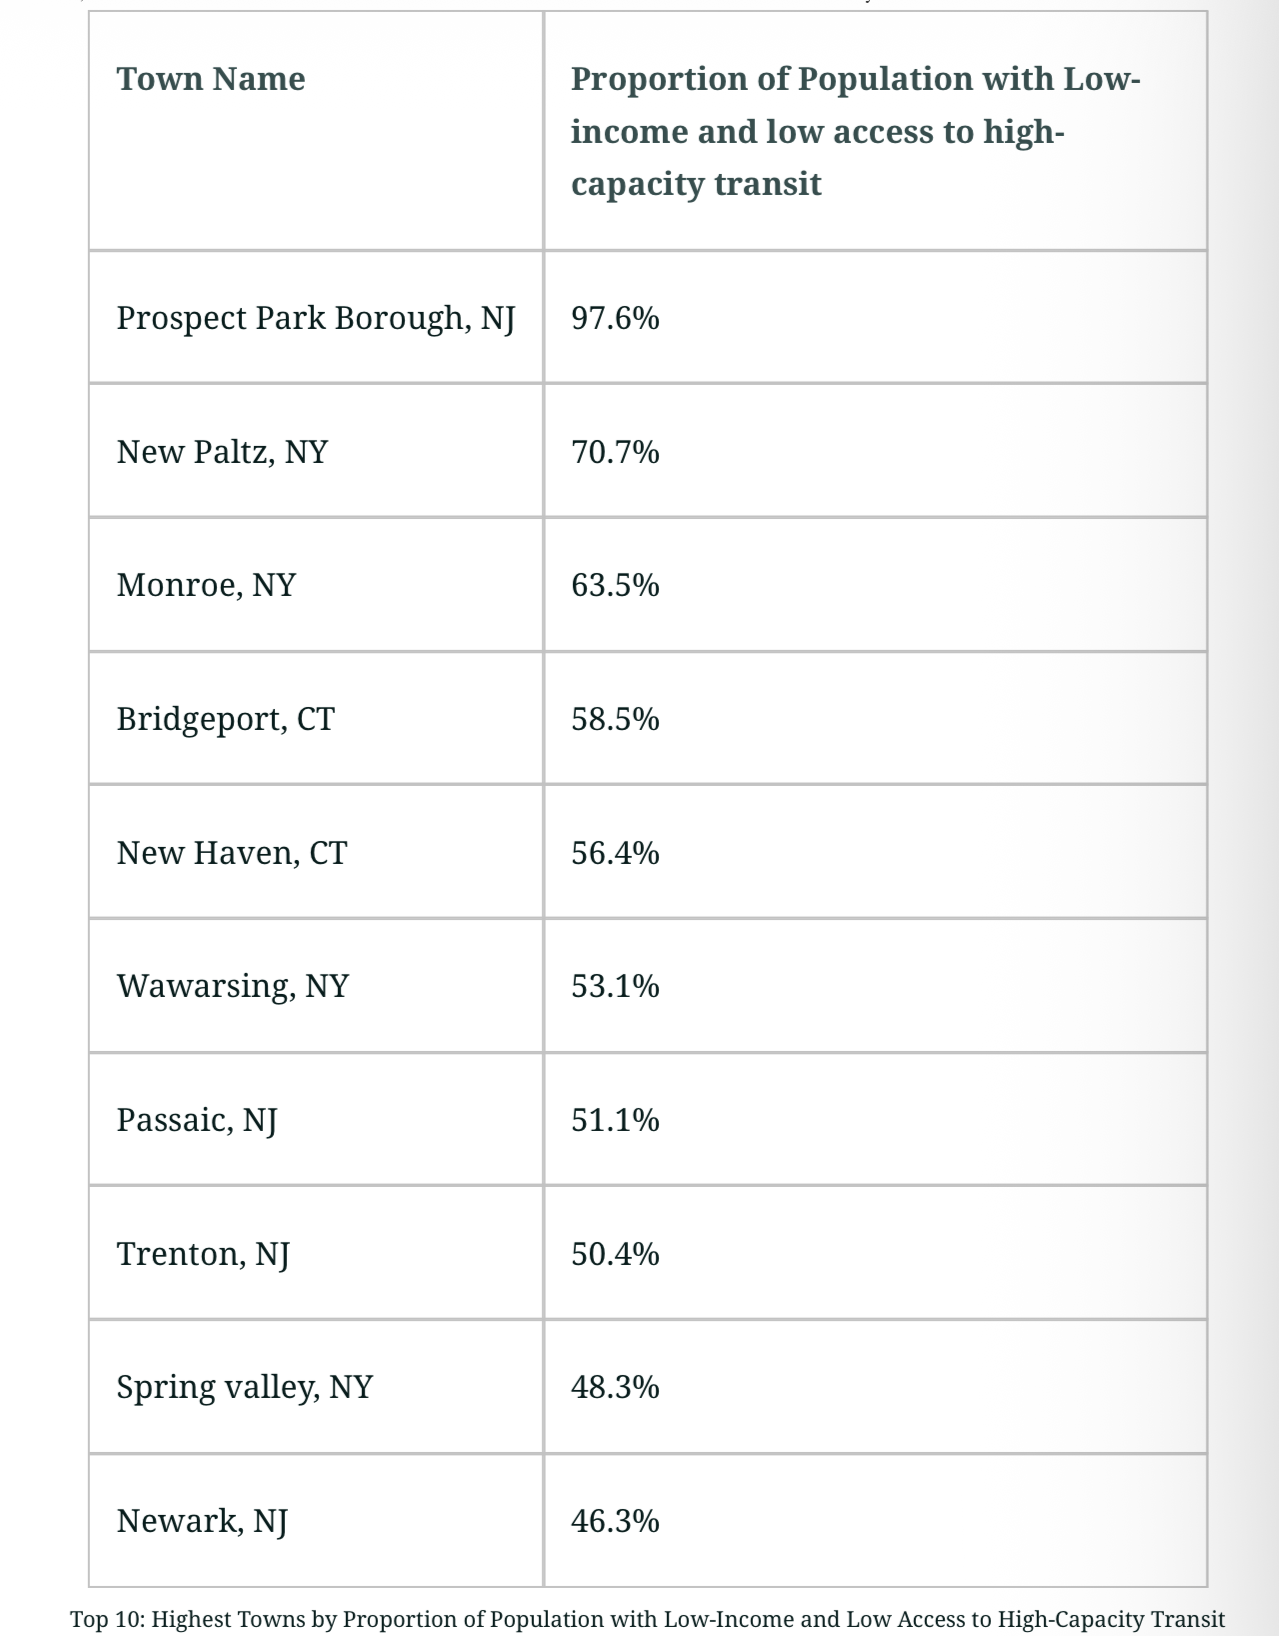
Using this dashboard, we can explore the NYC Metro Area to see different towns and their proportions of low-income residents with low access to high-capacity transit. To understand the areas with the most vulnerable population, I created a table, as seen below.
Important Limitations
While it is important to quantify the proportion of low-income residents without access to high-capacity transit, many cities with this problem have addressed this by using buses. This includes cities in New Jersey, like Newark, that have a large proportion of low-income residents without access to high-capacity transit. As seen below, NJ Transit has an extensive network, which includes many areas in Newark that suffer from low-access.
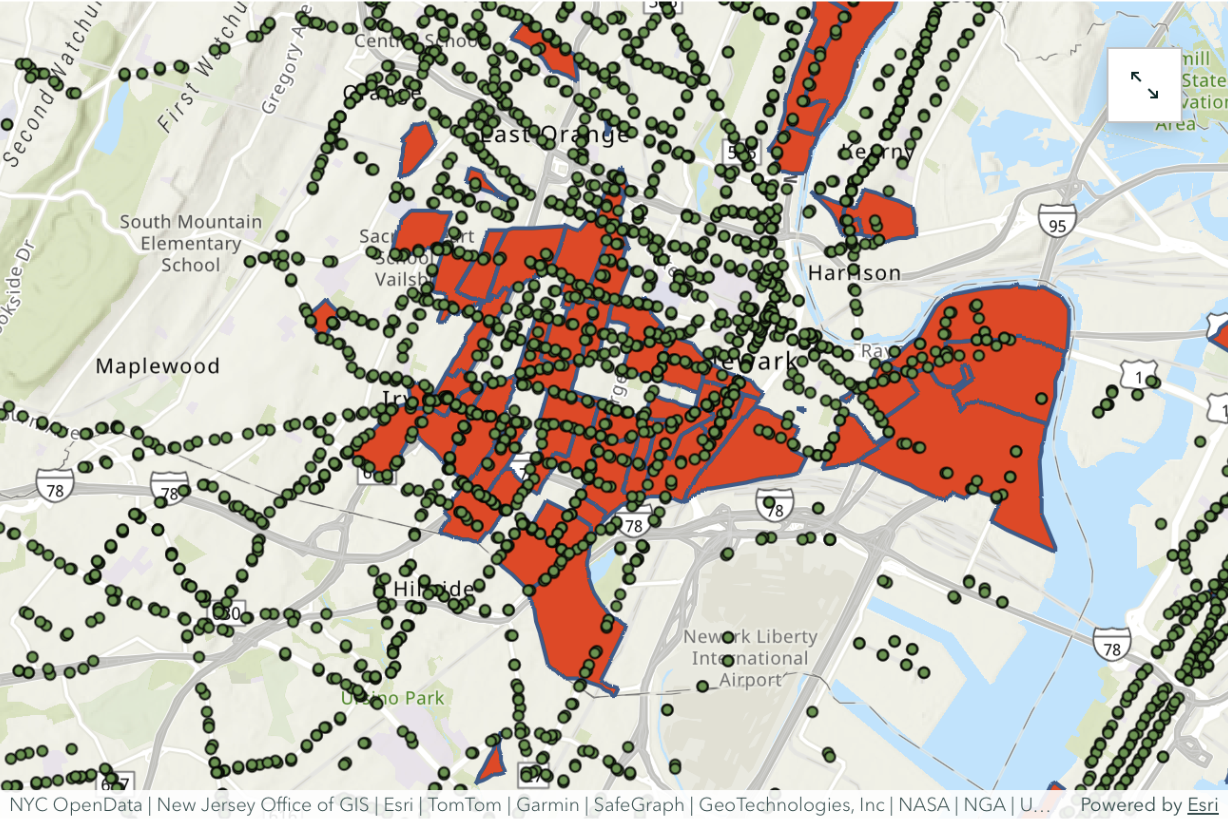
Figure 5: Newark, NJ: NJ Transit bus stops and low-income areas with low access to high-capacity transit
Low-capacity types of transit, such as buses, can often be a 'last-mile' form of transit, meaning that individuals can use high-capacity transit and then transfer to a low-capacity transit system, such as a bus, to reach their home.
Additionally, the methodology likely overestimates the "vulnerable population" (meaning low-income and low access to high-capacity transit). Because data was used from designated vulnerable Census Tracts, and not every person in a vulnerable census tract will be vulnerable, the methodology likely overestimates this quantity. However, with this overestimation, the areas with a higher proportion of vulnerable population will likely still have a higher vulnerable population even with perfect estimation. Therefore, the methodology can still be used for finding areas to prioritize high-capacity transit expansion.
Concluding Information
All in all, my analysis identifies specific high-need areas where a significant proportion of the population is both low-income and lacks high-capacity transit access. This is a spin-off of SDG 11.2.1, with my analysis focusing specifically on low-income areas lacking high-capacity transit. In order to meet goals for SDG 11, Sustainable Cities, regional investment must prioritize these 'red-areas' for future high-capacity transit extensions.
While buses currently fill many gaps, access to high-capacity transit should be the ultimate goal, as equitable urban development means all communities having full access to the best-possible transit.
Adding the 'low-income' lens to SDG 11.2.1 moves the calculation from simple and general and towards achieving environmental justice, ensuring the NYC Metro Area becomes more sustainable and equitable for all residents.